See, understand, and act on data.
Accelerate decision-making with interactive dashboards and business intelligence tools that give you insights into your expense data.


Accelerate decision-making with interactive dashboards and business intelligence tools that give you insights into your expense data.
Expensya Insights is an enhanced module that provides a detailed level of analysis into your employee-initiated spend so you can make strategic decisions about your cashflow. The dashboards emphasize easy trend identification and pattern detection.
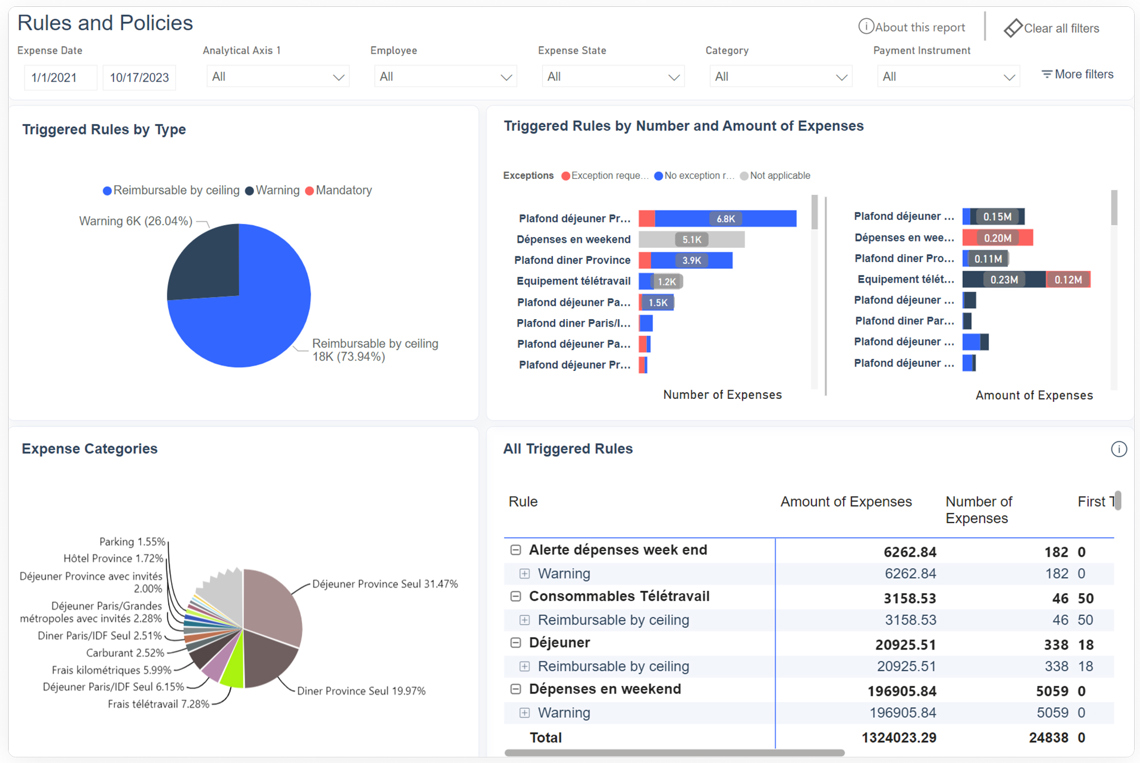
Spending policy statistics give you a comprehensive view of your spending rules and their application. It allows for proactive amendments to your spending policy and better resource management.
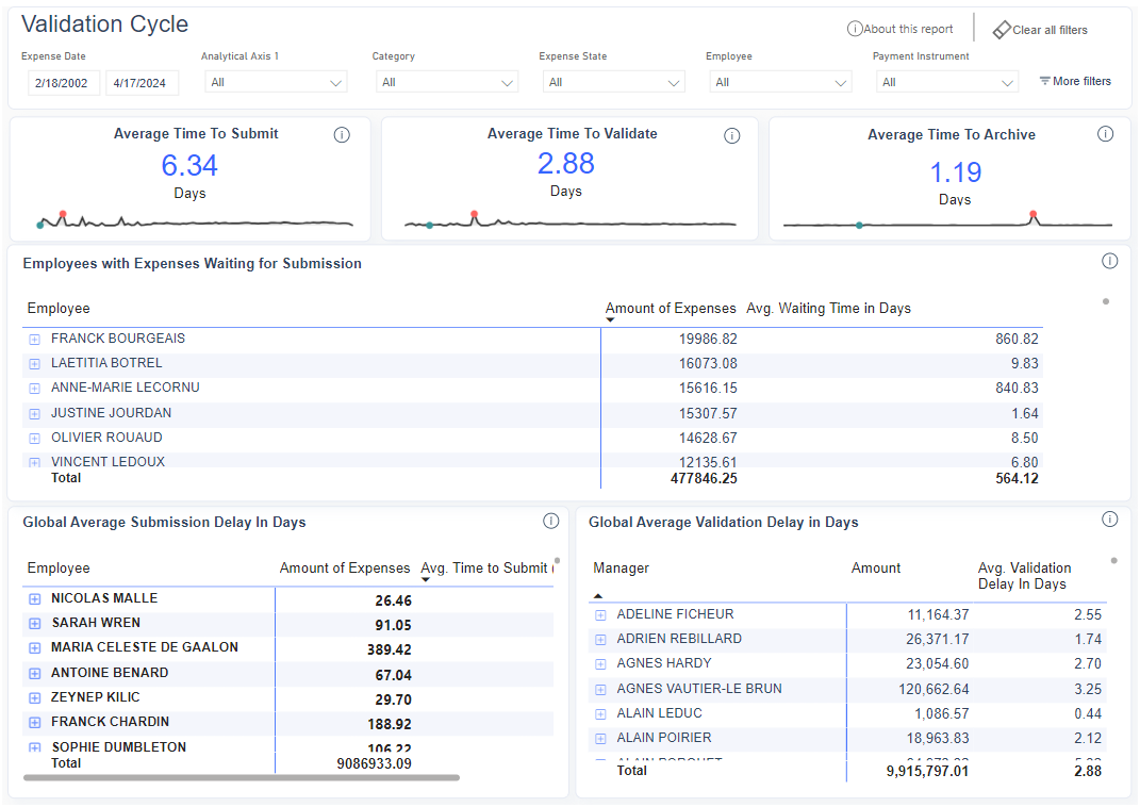
Approval cycle analysis can help identify bottlenecks and streamline the approval process by systematically tracking the time taken for each step of the expense clearance process.
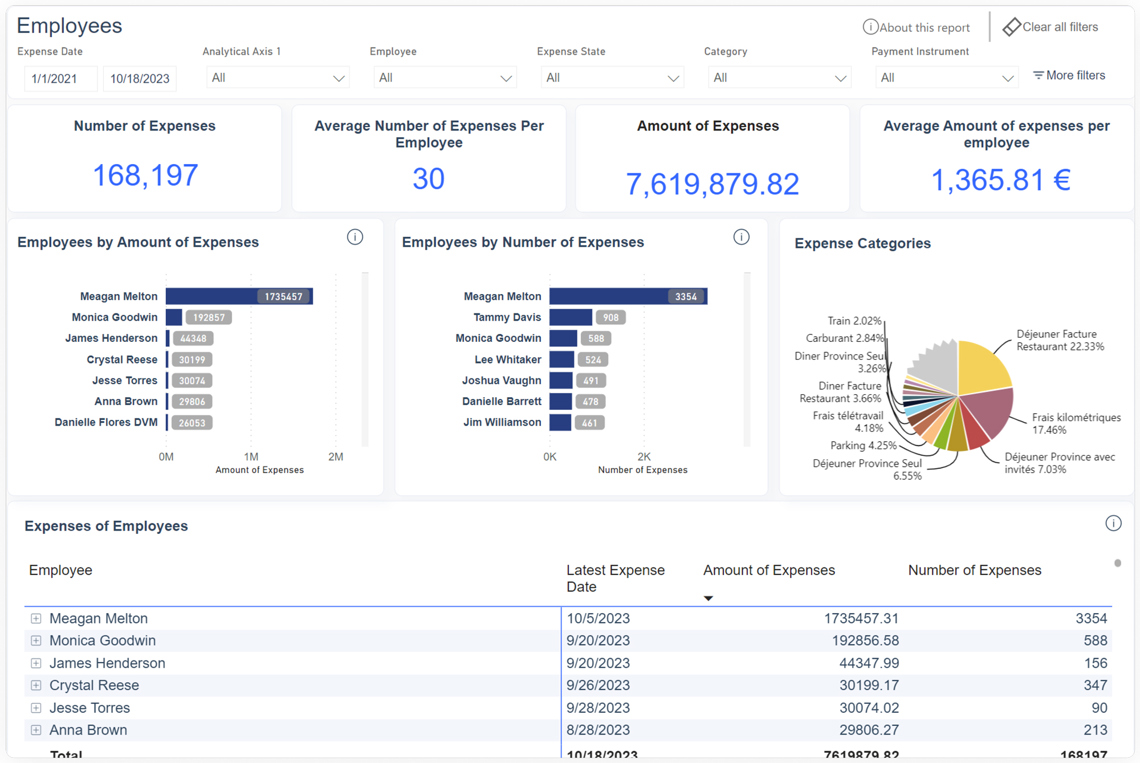
With expenses by employee, you get a breakdown of individual spending which can be useful for strategic resource allocation.
![]()
![]()
Visualize your expense data with Microsoft Power BI dashboards. All incurred expenses are consolidated and centralized in interactive dashboards generated by Power BI to help you explore your data and efficiently manage your expenses.
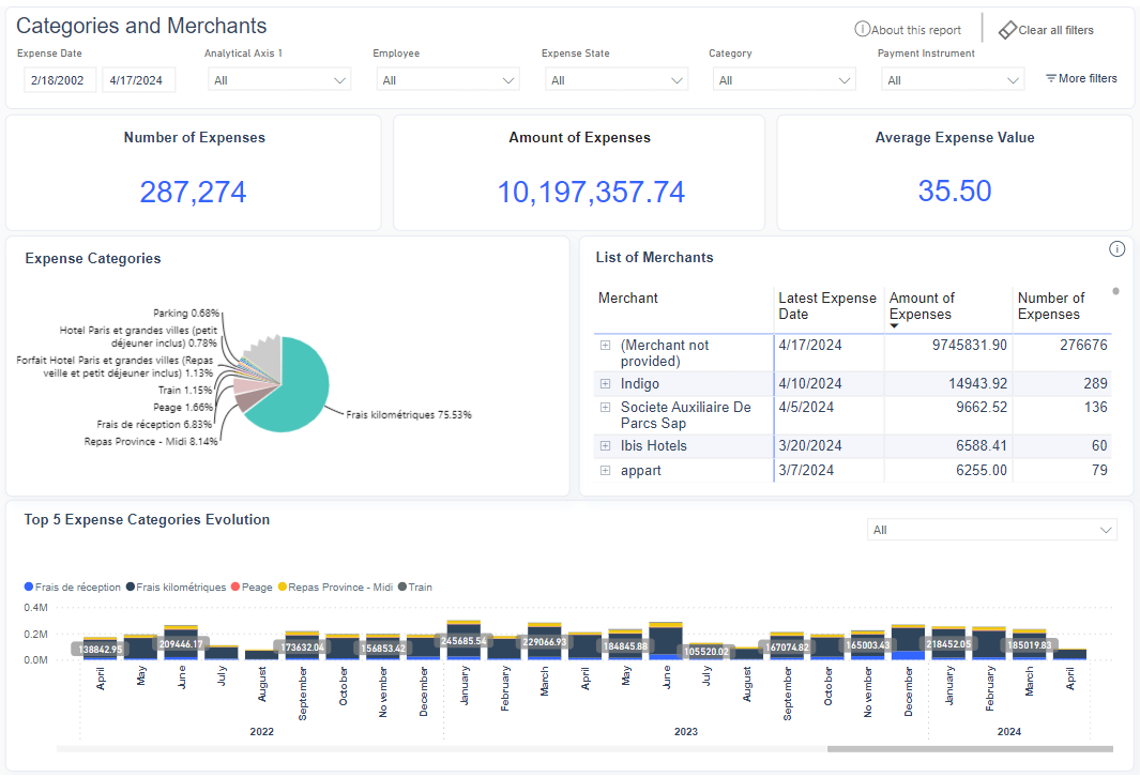
Expensya gives you a data cube to easily slice, dice and roll up data to view it from different angles. You can focus on subsets of information so that you can find answers to specific questions, find trends, patterns or anomalies giving you valuable insights.

View your company’s expenses in real-time to help manage your cashflow. Create personalized reports that you could view by project, by geography or by supplier.

"Expensya allows us to be one step ahead, and to do more consulting by always having real-time access to the necessary data."
Yohan Raccah
Founder & CEO

"I had a hard time finding a tool that met the specific needs of accountants, who were looking for an analytical breakdown across several accounts and who were adamant on this matter. This drew us to Expensya, as everything is customizable!"
Sophie Anselin
IS Project Manager

"This is what I appreciate about Expensya: There are lots of configurations that allow us to adapt the solution to our needs, form a technical standpoint or on the interface. We have in-house terms that better correspond to our activity. This capacity to customize is highly suited to our company!"
Damien Lopez
Project Manager