KPIs in Automatic Coding Suggestions: The Untold Truth
Authors: Grzegorz Kępisty, Paweł Bączyk, Daniel Klepacki, Michał Cerazy, Łukasz Wiatrak, Robert Szabo
In the context of Accounts Payable, Automatic Coding Suggestion (referred to as “SmartFlow” at Medius) is a process where accountants save time using Machine Learning solutions. The modeling area is complex due to a) an increasing number of predicted classes; b) an unbounded number of coding lines in the table; and c) variations in accounting practices among companies/countries, as well as a lack of documentation. The challenges in this topic extend beyond machine learning predictive design, encompassing the analytics area and making it a complicated issue to address. Technical, numerical, and logical problems arise when comparing predicted coding tables and their corresponding ground truth values. In fact, linear programming is necessary for a well-defined approach to metric definitions.
In this article, we propose new industry-standard KPIs that can be used to compare coding suggestion performance across different solutions. We describe several KPIs suitable for process evaluation and present their variants and biases. These KPIs are often not explicitly defined in product presentations, making it impossible for clients, businesses, and model developers to compare numbers. To clarify this ambiguous situation, we outline clear and reproducible practices based on years of experience at Medius.
As Walter Levin stated, “Any measurement that you make without the knowledge of its uncertainty is completely meaningless”. We believe that any metric without an exact definition holds even less value.
Context of coding suggestions
The Accounts Payable area of automation encompasses several steps, including invoice capture, invoice coding, line matching, verification, fraud detection, and processing for payment. General ledger coding involves classifying all company expenses and determining how they should be accounted for; this has traditionally been done by accountants or individuals working in accounting/finance. Each non-PO invoice requires the attribution of a Coding Table (CT) that comprises Coding Lines (CL). Each CL contains properties referred to as Accounting Dimensions (or simply, Dimensions) with corresponding values (Segments), which are to be declared during the invoice flow.
The topic of General Ledger Coding Suggestions [1] [2] presents several levels of complexity:
- An invoice can have one or more coding lines, and that amount is unbounded (even > 1000);
- Coding Lines may differ from each other, but duplicates are possible;
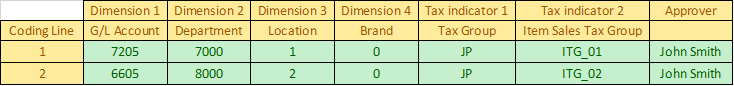
Figure 1. Exemplary Coding Table with possible descriptions of dimensions. - The number of values possible for different dimensions is company/tenant-dependent and evolves over time (new values emerge while some are abandoned over time);
- The number of dimensions in use varies between tenants (from 2 to 12), and it may even differ among coding lines within a single invoice;
- Normally, the order of CLs does not matter from the end-user perspective;
- The tenant/company-level practices from points a-d are typically not present in any formal documentation at the client-side.
As a result, Coding Suggestions can be described as a “multi-label classification with incremental and unbound number of classes” in terms of predictive problems. This category belongs to the most challenging ones, and good practices in this domain have not yet been established. Some theses focusing on predictive modeling have been published, albeit without a description of the problem's depth [3] [4].
One statistic worth examining is the average contribution of multi-line coding suggestions to the overall flow of invoices. While the flow is dominated by 1-line CTs, multi-line CTs maintain a stable share in the population. Multi-line CTs correspond to about 21% of all non-PO invoice documents and approximately 55% of all coding lines and coding segments that are archived. This is the primary motivation for using the line matching approach in the analytics area. Without it, there is no certainty in how the metrics are computed.
Challenges in metrics definitions
Well-defined metrics are a starting point and requirement for predictive model development, AP System Analytics, and the comparison of quality with other AP products/providers. The fundamental problem that must be addressed is, “How to quantitatively compare predicted CT with Ground Truth CT?”. The following factors make the task challenging:
- CTs may have a different number of coding lines
- CTs may use different dimensions
- CTs may have lines present in different order.
While points a and b can be approached by simple padding of CT with null values and empty CLs, point c introduces ambiguity into the task. This is presented as examples in Fig. 2.
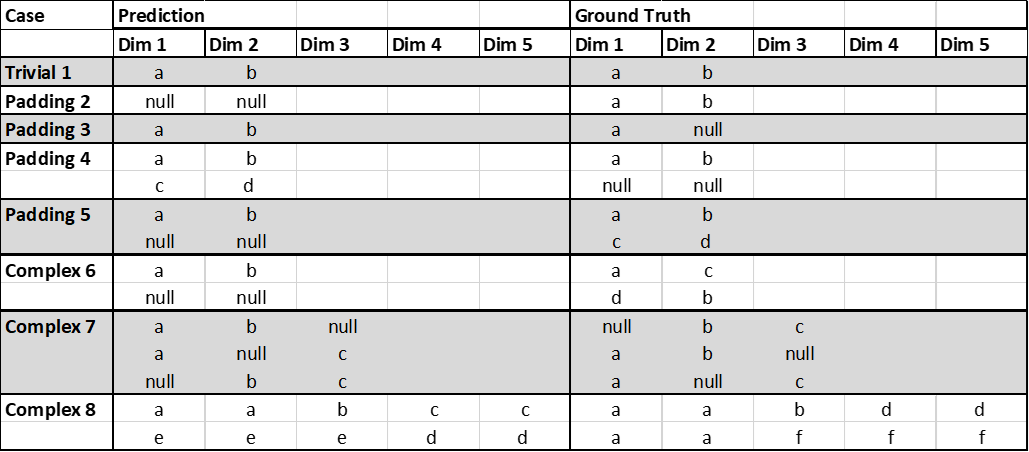
Figure 2. Increasing complexity of CT comparison. The varying size of CT can be addressed in simple cases by using padding (2-5) and a greedy matching algorithm. However, this approach does not resolve cases such as draws (6), global optima (7), or local optima (8).
To quantitatively compare CTs, three steps need to be taken to make the process deterministic:
- Ensuring both tables have exactly the same sizes (padding with null values),
- Matching CLs from prediction and ground truth (trivial for 1-liners),
- Computing metrics per dimension with summation over lines (CL order irrelevant).
Point 1 is trivial (defined by the longest CT and the largest common set of used dimensions). Point 2 requires the definition of a fitness function to be maximized by the optimal match. The number of possible combinations grows as N! for CT of length N. This is a special case of the classic NP-hard Assignment Problem [5]. There are exact and approximate solutions to this problem, and in another section, we describe in detail how we approach it in the context of unbounded size of CT (number of CLs).
After matching lines according to some defined logic, the confusion matrix per dimension can be computed (TP, FP, TN, FN categories). The confusion matrix per document/dimension serves as an entry point for the actual computation of KPIs (next section).
Classification of metrics
There are several aspects that must be stated during definition of CT KPIs. Those relevant have been assembled in Table 1 below:
Table 1. Most common properties for defining Coding Table's KPIs.
| Property of KPI | Variants | Description / Comments |
|---|---|---|
| Level | Per Segment (Micro) or Coding Line or Document (Macro) | Dimension level confusion matrix can be used directly for computing KPIs OR aggregated first. Then the average over CLs or Documents may be applied. |
| Stiffness | Elastic or Stiff | CT can be regarded as single class and even a single segment difference could lead to discarding is as incorrect. |
| Metric type | Accuracy, Precision, Recall | Classic metrics |
| Dimensions/Segments subset | All dimensions (12) or some subset (e.g. Dim1+Dim2). Including tax codes and approvers or without | In some cases, analysis can be narrowed for simplicity. |
| Number of CL subset (NCL) | All lengths can be considered or only 1-liners or up to 5 NCLs. | Very long Coding Tables may be considered as outliers. |
| Capture Variant | All invoices OR second time Coding Suggestion | If correct CT values are considered known and occurred in the past. |
It can be easily noted that if one considers the whole space of possible KPIs, there may be thousands of different single-number metrics being defined. This means that a quite exhaustive explanation is required to clarify what one understands as “accuracy” in the context of Automatic Coding Suggestions.
Internet review on CS metrics
To provide some insight into what is used in practice by Accounts Payable solution providers, we examined the descriptions of metrics presented in the context of CS on the internet. We used search phrases such as “automatic coding suggestions account payable”. The overview is shown in Table 2.
Most accounts payable products do not mention any specific details regarding the performance of coding suggestions. Occasionally, “accuracy” is mentioned without further description. It can be stated that there is currently no way to approach product comparison, as usually neither value nor description is present on the official websites. Also, separating the metrics from the rest of the invoice automation area is worthwhile, because the metrics associated with Coding Suggestions typically lack clear definitions. This was one of the motivations behind this article.
In summary: any well-defined CS metric is currently better than the public communication on the topic found on the internet.
Table 2. Online mentions of metrics and definition on Automatic Coding suggestions as defined using organic search terms.
| Number | Examples of values and names | Metric description | Source |
|---|---|---|---|
| 1 | “89% touchless processing” “improves the accuracy of coding proposals” |
none | Commercial website |
| 2 | “Accuracy improves over time” | none | Commercial website |
| 3 | “Prediction accuracy of the AI” “AI learns from your historic coding and workflow data and increases invoice automation immediately up to 90%” |
none | Commercial website |
| 4 | “Increased Accuracy” | none | Commercial website |
Practical solutions and choices
KPIs selection
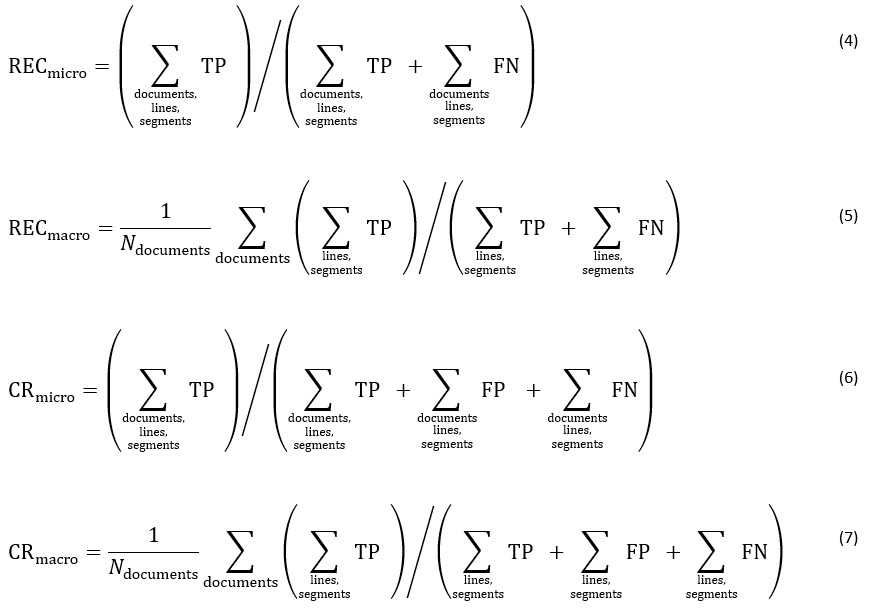
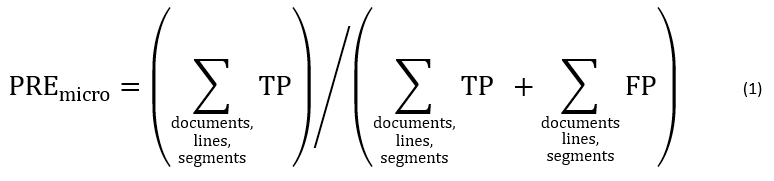
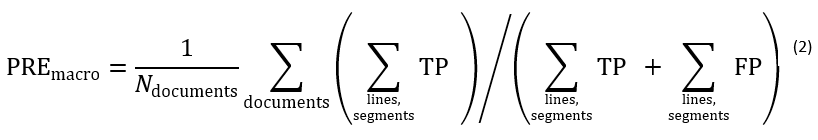
In Medius, we use both micro and macro KPIs to describe CS in practice. These include accuracy, precision, and recall, as well as Coding Rate (Critical Success Index, [6]). Most often, we use them in the variant of "15 segments," which means 12 coding dimensions + 2 tax codes + first approver. These metrics are typically computed for all invoices, and occasionally a filtering over the number of CLs in the suggestion is applied. Below, the exemplary formulation of Precision (PRE) is shown in Equations 1-2. Analogous formulas for Recall (REC) and Coding Rate (CR) are given in the Appendix section.
Confusion matrix definition
For the sake of clarity, we also define the behavior of the confusion matrix in all cases that may occur within two matched CLs being compared. This is shown in Table 3 below. Notice that the TN case, despite being defined, is not used for KPI calculations (e.g., it does not contribute to the denominator of accuracy). This is because the majority of coding segments are generally not used by most tenants, so using this large number of TNs would bias the metrics.
Table 3. All cases of confusion matrix for a padded Coding Table.
| Confusion Matrix | Predicted Segment | Ground Truth Segment |
|---|---|---|
| TP (True Positive) | Value1 | Value1 |
| FP (False Positive) | Value1 | Value2 |
| FP (False Positive) | Value1 | null |
| FN (False Negative) | null | Value1 |
| TN (True Negative, not used) | null | null |
Matching coding lines
There are three factors determining the optimal or at least acceptable approach to matching coding lines at the evaluation step:
- Matching must work for any number of coding lines,
- Quality of matching should be “as good as possible”,
- The procedure should be computationally fast.
During the matching of lines, a definition of “matching quality” is required. While many formulations are possible, we propose a simple maximization of TPs during line matching while minimizing FNs. This is shown in Equation 3 below; the constant 0.0001 has been derived empirically.

Now, while such a target works reasonably in all cases, it must be pointed out that the optimal matching can be degenerated (with >1 line permutations leading to the same optimal fitness value). We are aware of this, and in such cases, any (first) solution is taken.
Having defined what an optimal match is, the numerical method for reaching a solution depends on the instance size (Number of Coding Lines - NCL). We empirically determined the following approach:
- NCL ≤ 7 – All permutations are listed, evaluated, and compared sequentially,
- 7 < NCL ≤ 100 – The solution is found using linear programming formulation (Python pulp module [7]),
- NCL > 100 – We use a greedy algorithm (described below).
These boundaries were chosen to satisfy computational time requirements. Both a and b are exact, and NCL=7 is the point at which the latter becomes faster. Beyond NCL=100, to balance the efficiency trade-off, we had to abandon the exact solution in favor of an approximate greedy method. On those occasions, the coding suggestion most often has negligible length compared to the Ground Truth, and the use of the Greedy algorithm is justified (a vast majority of the confusion matrix will be FNs). In simpler terms: lines from the shorter table (before padding) are matched sequentially in a greedy way to the other table, and remaining lines receive padded empty lines afterward. This approximation is used in our reasoning.
Data supporting choices
The choices around line matching aim to achieve results "as good as possible in an acceptable time." Fig. 3 shows time measurements for the execution of line matching algorithms. The three considered regimes are our solution of choice, applied in R&D practices.
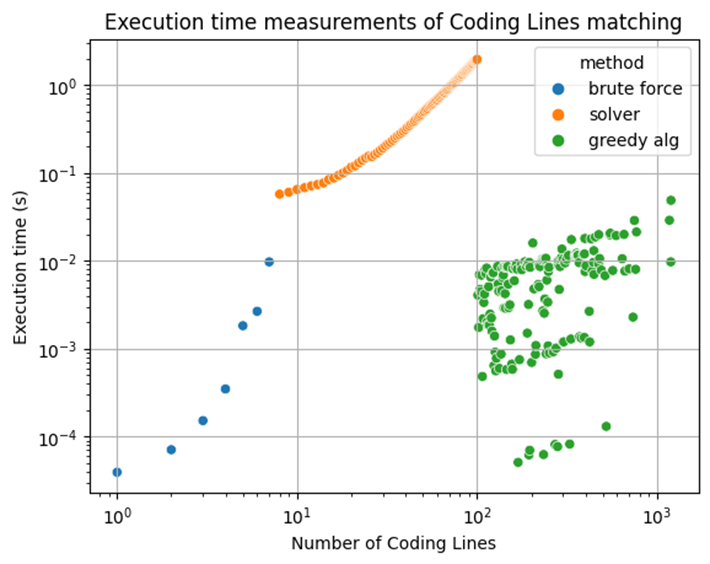
Figure 3. Sequential execution time of Coding Lines Matching (Python).
It is important to illustrate the practical differences between micro and macro KPIs that can be used for describing the quality of automatic coding suggestions. In short:
- Micro KPIs have equal contributions from each coding segment. One can assume that the number of coding segments is closely related to the actual work of accountants involved in filling CTs. From this perspective, micro KPIs measure the level of automation in terms of real-world time and are more representative of end-user savings.
- Macro KPIs are computed per document and then averaged with equal weights. As a result, documents with a large number of CLs have a much lower contribution to overall metrics when compared to micro KPIs. Because huge CTs are generally a rare event, this may be considered as a way of outlier regularization. In other words, invoices using more dimensions have the same weight as those with simpler coding.
The practical outcome of these properties is that real macro KPIs are, in practice, "higher" than analogous micro metrics. We demonstrate this in the real example in Fig. 4, where the predictions of illustrative tested models are evaluated into KPIs in both micro and macro ways (precision-coding rate curves).
Depending on the model threshold, the difference in Coding Rate exceeds 10% in favor of macro KPIs.
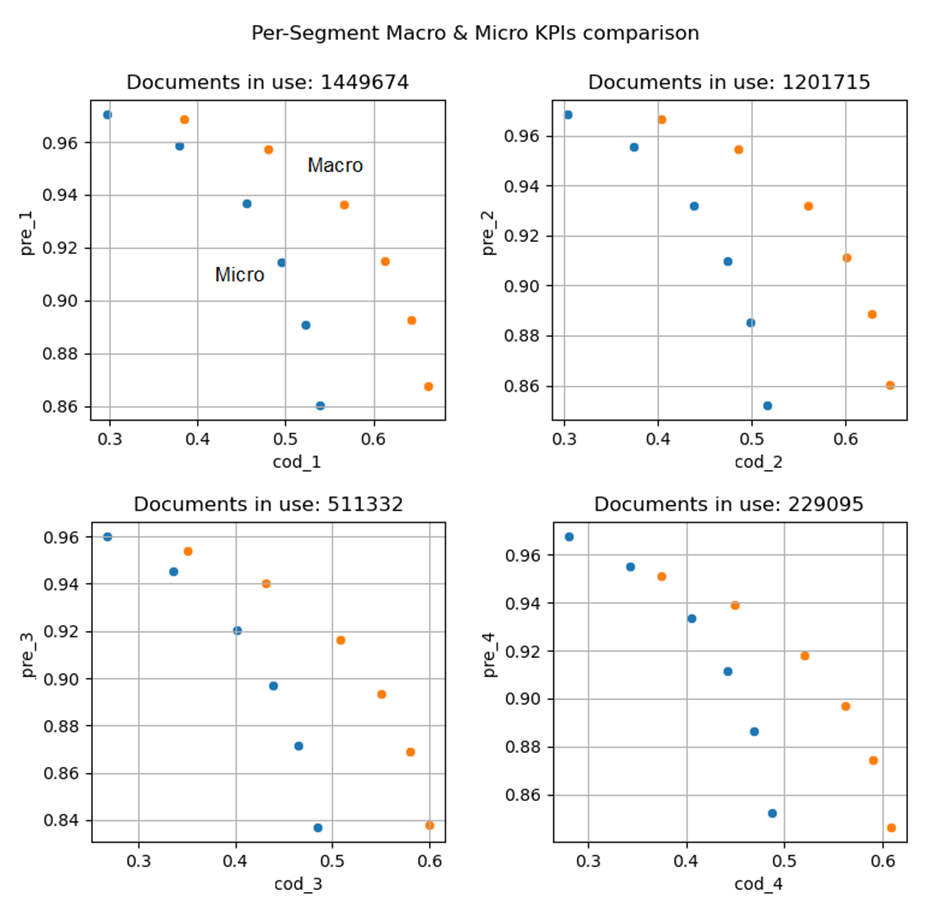
Figure 4. Discrepancies of Micro and Macro KPIs for four coding dimensions.
Possible ways of abusing metrics
Vendors of Automatic/Smart/ML/AI Coding Suggestions products may have incentives to present or describe KPIs that are as high as possible to attract potential clients. In this section, we review potential practices that may lead to displaying numbers higher than expected. The list (which is probably not exhaustive) is shown in Table 4 below.
Table 4. Possible ways to manipulate metrics.
| No. | Name | Description |
|---|---|---|
| 1 | Tenants filtering | Computing KPIs from only best-performing clients. |
| 2 | Time range filtering | Computing KPIs from more favorable periods of time. |
| 3 | NCL filtering | A smaller number of CLs is an easier predictive task. |
| 4 | Second time coding filtering | Skipping cases when expected CT did not occur in the past. |
| 5 | Limit dimensions scope | Focusing on a smaller number of dimensions makes for an easier predictive task. |
| 6 | Presenting only macro KPIs | Giving lower weights to huge CTs will, in practice, boost KPIs. |
| 7 | Skipping line matching in evaluation | Comparing sets of dimensions’ values yields higher KPIs than expecting line structure. |
This table is not a claim that anyone practices such methods. It is rather a clue for clients as to how complex the topic of preparing KPIs is and what may be presented to them during the product demo or as part of an RFI.
Summary and conclusions
In this paper, we explored the complexity of analytics in the domain of Automatic Coding Suggestions. We identified multiple factors that complicate the CSs (i.e., the task of providing the end user with an useful coding table proposal) as a predictive problem and explained why it is not straightforward to compute KPIs of a prediction in the context of multi-line instances.
We discussed the practices of making metrics a) deterministic, b) reproducible, and c) computationally efficient in the context of Coding Suggestions. We shared demonstrative data justifying our choices and explained why the selection is significant.
Additionally, we verified in the literature that such descriptions of good practices (or even broader: ANY practices) are not readily available on the internet, which motivated this article.
Finally, we provided a list of possible practices for manipulating data and metrics to make them appear better than their real-world counterparts.
In our opinion, this paper is useful from a variety of perspectives:
- Improving awareness for clients regarding the potential meaning of presented KPIs,
- Encouraging vendors to clarify how measurements are performed,
- Facilitating developers with ways of comparing the performance of their models with competitors, which we believe will result in better performance of such solutions in the market in general.
Bibliography
| [1] | [Online]. Available: https://support-go.medius.com/en/support/solutions/articles/103000096968-coding-suggestions |
| [2] | [Online]. Available: https://blog.mihlfeld.com/the-basics-of-gl-coding |
| [3] | [Online]. Available: https://kth.diva-portal.org/smash/get/diva2:1461111/FULLTEXT01.pdf |
| [4] | [Online]. Available: https://publications.lib.chalmers.se/records/fulltext/219162/219162.pdf |
| [5] | [Online]. Available: https://en.wikipedia.org/wiki/Assignment_problem |
| [6] | [Online]. Available: https://en.wikipedia.org/wiki/Confusion_matrix |
| [7] | [Online]. Available: https://pypi.org/project/PuLP/ |
Appendix